
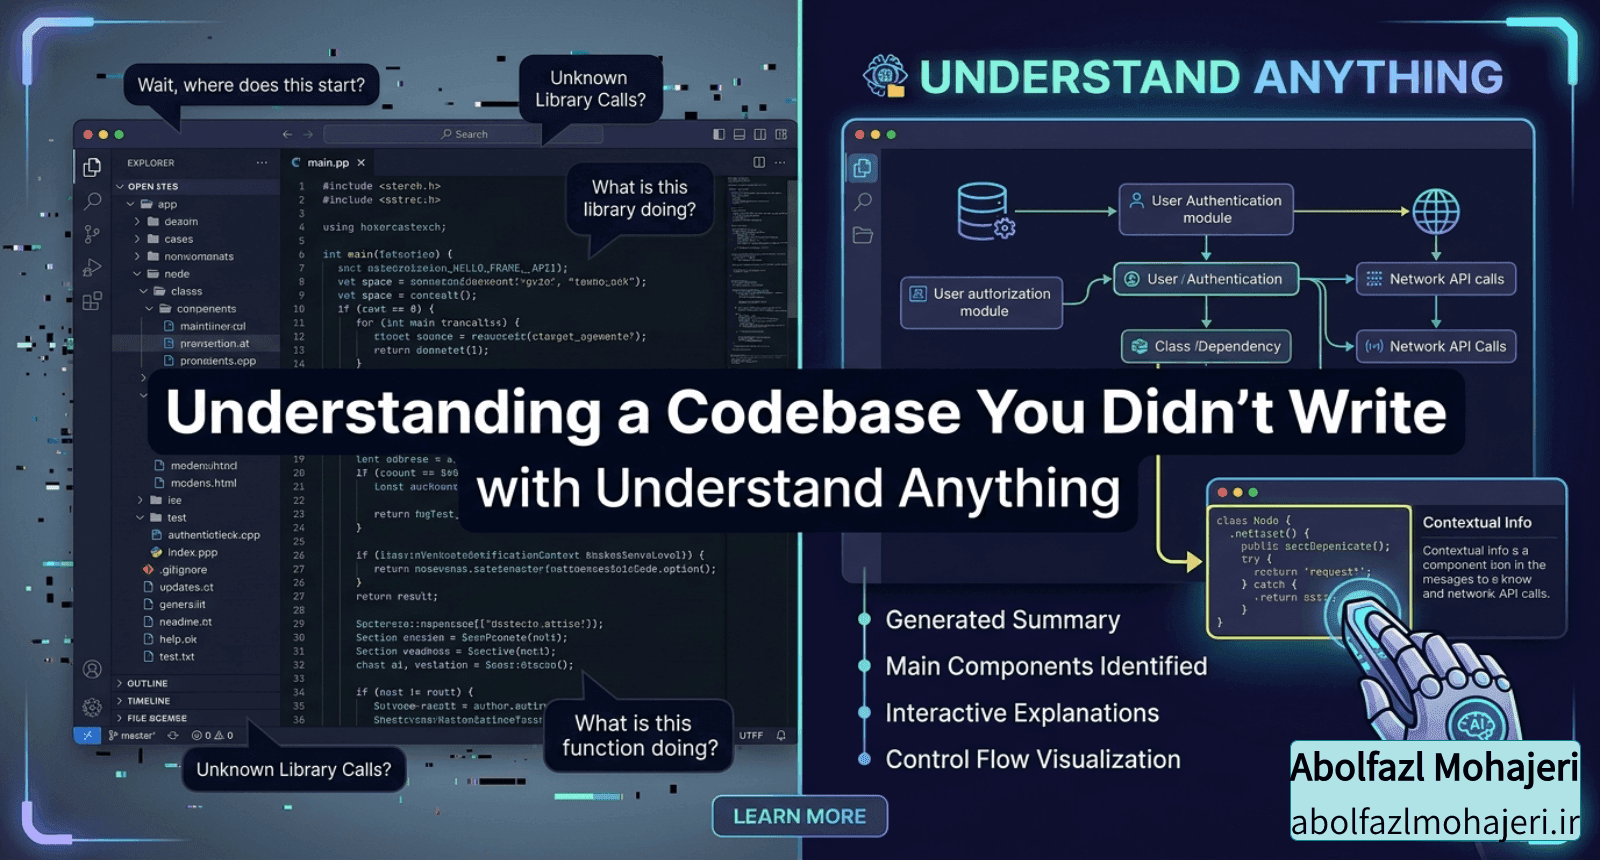
Understanding a Codebase You Didn't Write with Understand Anything
Every backend developer knows this feeling. You join a new team, clone the repo, and stare at 200,000 lines of code spread across a dozen microservices. The README is half outdated. The person who wrote the auth flow left six months ago. And your first task is to "just add a small feature here."
I've lived this more than once. When everything is connected, the hardest part isn't writing code. It's building a mental model of how the pieces fit together before you dare to touch anything.
Most "code graph" tools don't help here. They render a hairball of nodes and edges and proudly tell you the codebase has 1,400 files. Great — now what?
A Graph That Teaches
Understand Anything is an open-source plugin that turns any codebase into an interactive knowledge graph you can actually explore and learn from. The pitch that sold me is right there on the homepage: other tools show you structure, this one shows you meaning — how your code maps to real business domains, processes, and flows.
It runs as a plugin for Claude Code, but also works with Codex, Cursor, Copilot, Gemini CLI, OpenCode, and a long list of others. Under the hood it analyzes your project with a multi-agent pipeline, builds a graph of every file, function, class, and dependency, then hands you a dashboard to explore it all visually.
How It Actually Works
The clever part is the hybrid approach. It doesn't rely purely on an LLM guessing about your code, and it doesn't rely purely on a parser that can't understand intent. It uses both:
Tree-sitter (deterministic) parses your source into a syntax tree and extracts the hard structural facts — imports, exports, function and class definitions, call sites, inheritance. Same input, same output, every run. This is what makes the structural graph reproducible.
An LLM (semantic) then reads that parsed structure alongside the original source to produce what a parser never can — plain-English summaries, architectural layer assignments, and business-domain mapping. The why, not just the what.
That split is the whole point. The structural edges are stable and trustworthy, while the semantic layer captures what a file is actually for.
The /understand command orchestrates a handful of specialized agents — a scanner to discover files and detect frameworks, a file analyzer to extract functions and build nodes and edges, an architecture analyzer to identify layers, a tour builder, and a reviewer to validate the graph. There's also a domain analyzer that extracts business domains, flows, and process steps. File analyzers run in parallel and the whole thing supports incremental updates, so re-running it only re-analyzes the files that changed.
Get Started in 30 Seconds
If you're already using Claude Code, installation is two lines:
/plugin marketplace add Egonex-AI/Understand-Anything
/plugin install understand-anything
Then point it at your project:
/understand
The pipeline scans everything and saves a knowledge graph to .understand-anything/knowledge-graph.json. Open the dashboard with:
/understand-dashboard
You get an interactive web view of your codebase as a graph — color-coded by architectural layer, searchable, and clickable. Select any node and you see its code, its relationships, and a plain-English explanation of what it does.
On a non-Claude platform, there's a one-line installer instead:
curl -fsSL https://raw.githubusercontent.com/Egonex-AI/Understand-Anything/main/install.sh | bash
The Commands I'd Actually Use Day to Day
Beyond the initial scan, a few commands map directly onto real situations I run into:
Ask anything about the codebase
- /understand-chat How does the payment flow work?
See what your current changes will affect — before you commit
- /understand-diff
Deep-dive into one specific file or function
- /understand-explain src/auth/login.ts
Generate an onboarding guide for a new teammate
- /understand-onboard
Extract business domains, flows, and steps
- /understand-domain
That /understand-diff is the one that caught my attention. Knowing the ripple effect of a change before you commit — which services and flows it touches — is exactly the kind of thing that's painful to reason about manually in a tightly coupled microservice setup.
Sharing the Graph With Your Team
Here's the detail I appreciated most as someone who's written more than one internal onboarding post. The graph is just JSON, so you can commit it once and let teammates skip the whole pipeline. Anyone who clones the repo gets the map for free — ideal for onboarding, PR reviews, and docs-as-code.
You commit everything in .understand-anything/ except the local scratch files, and there's an --auto-update flag that installs a post-commit hook so the graph stays in sync with the code on every commit. No more "the diagram is three months out of date."
Why I Think It's Worth Trying
The framing on the project sums it up better than I can: the goal isn't a graph that impresses you with how complex your codebase is — it's a graph that quietly teaches you how every piece fits together.
For anyone who regularly inherits unfamiliar code, mentors new hires, or just wants a faster way to build a mental model of a system, this is a genuinely useful tool. It's MIT-licensed and open source, so there's no cost to giving it a spin on your own repo.
If you want to see it before installing anything, there's a live demo you can pan, zoom, and search right in the browser. Otherwise, point it at your messiest service and see what it teaches you.
Have you tried it on a large codebase? I'd be curious how it holds up on a multi-service setup — let me know in the comments.